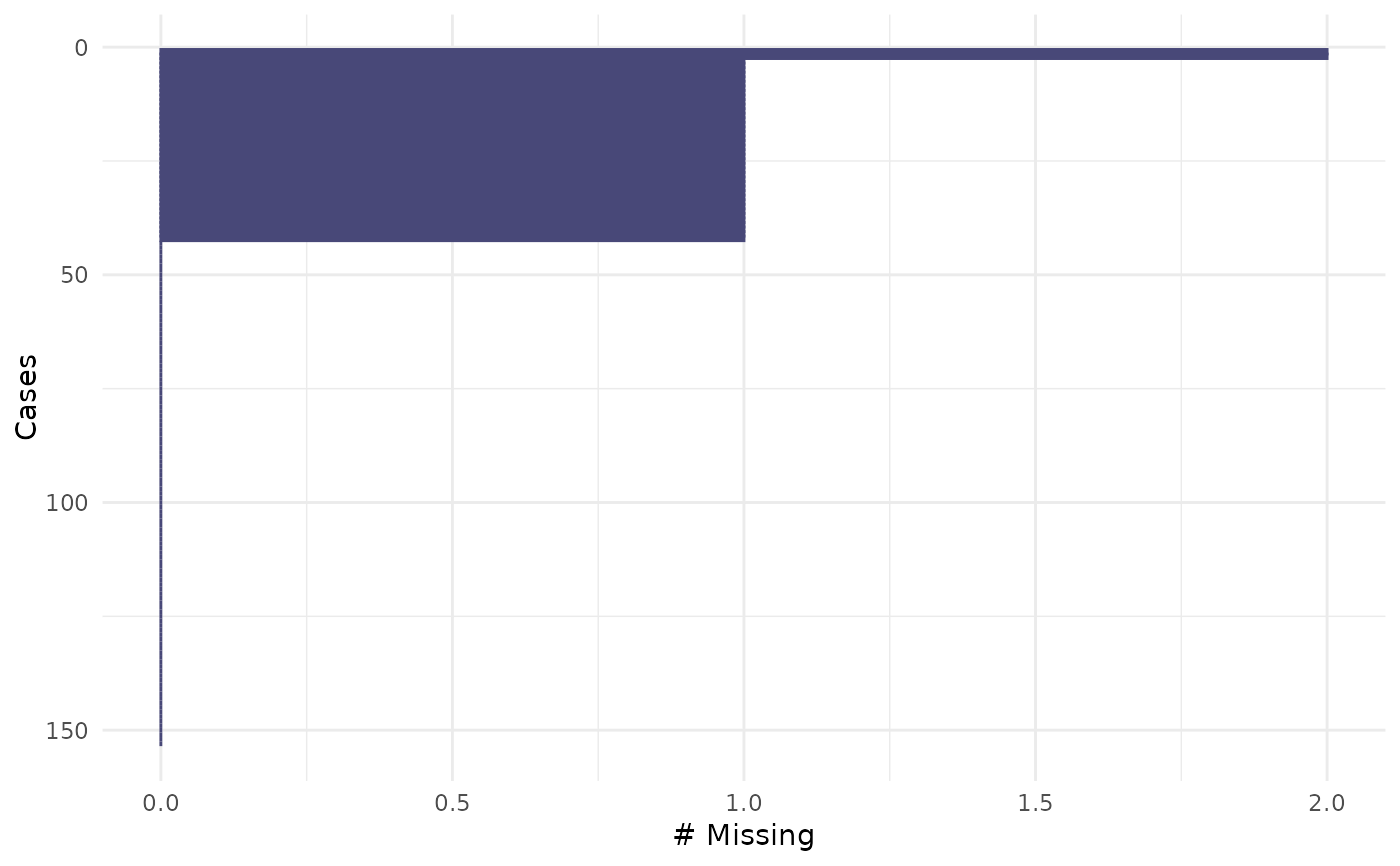
This is a visual analogue to miss_case_summary. It draws a ggplot of the
number of missings in each case (row). A default minimal theme is used, which
can be customised as normal for ggplot.
Examples
gg_miss_case(airquality)

if (FALSE) { # \dontrun{
library(ggplot2)
gg_miss_case(airquality) + labs(x = "Number of Cases")
gg_miss_case(airquality, show_pct = TRUE)
gg_miss_case(airquality, order_cases = FALSE)
gg_miss_case(airquality, facet = Month)
gg_miss_case(airquality, facet = Month, order_cases = FALSE)
gg_miss_case(airquality, facet = Month, show_pct = TRUE)
} # }