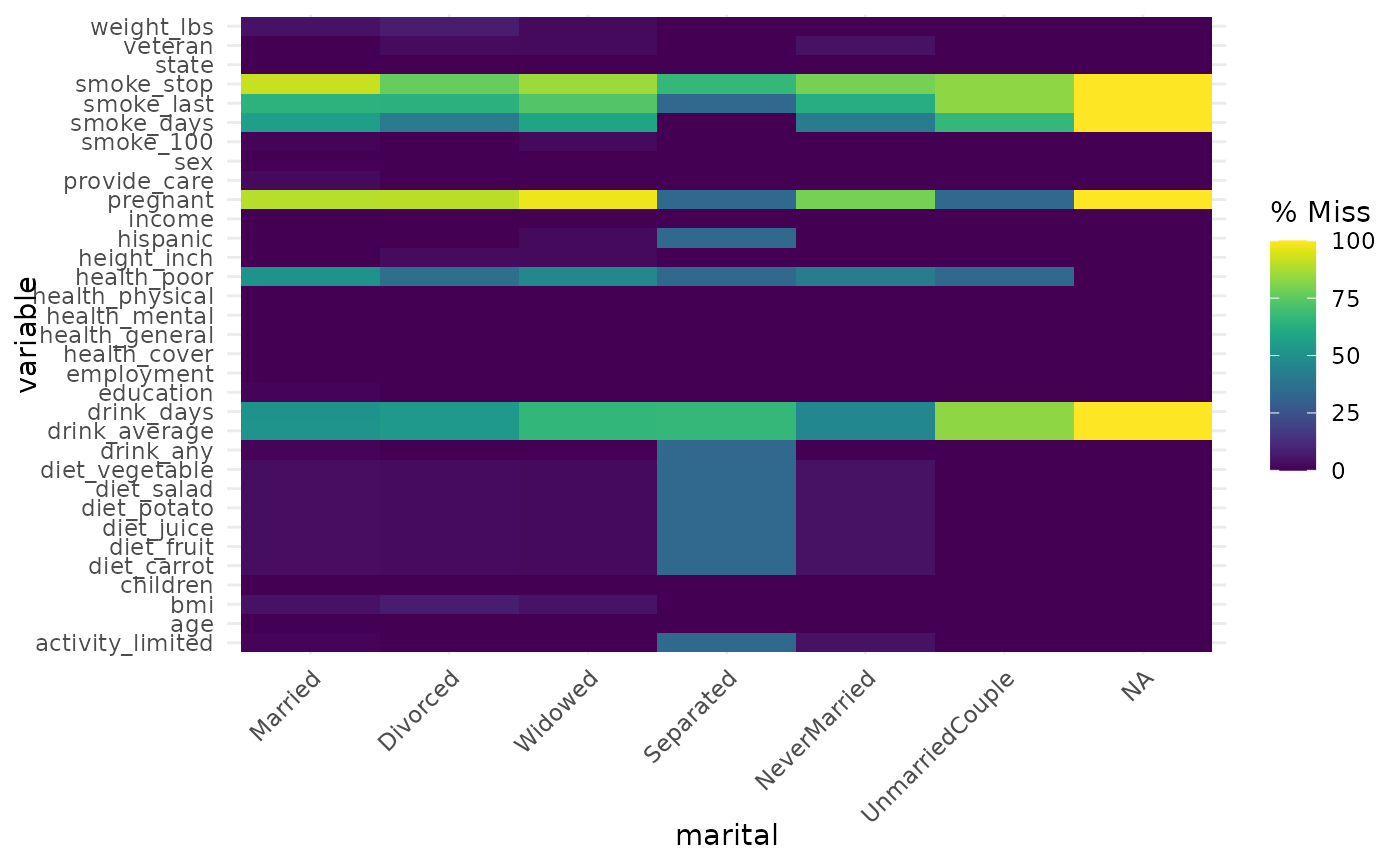
Plot the number of missings for each variable, broken down by a factor
Source:R/gg-miss-fct.R
gg_miss_fct.RdThis function draws a ggplot plot of the number of missings in each column, broken down by a categorical variable from the dataset. A default minimal theme is used, which can be customised as normal for ggplot.