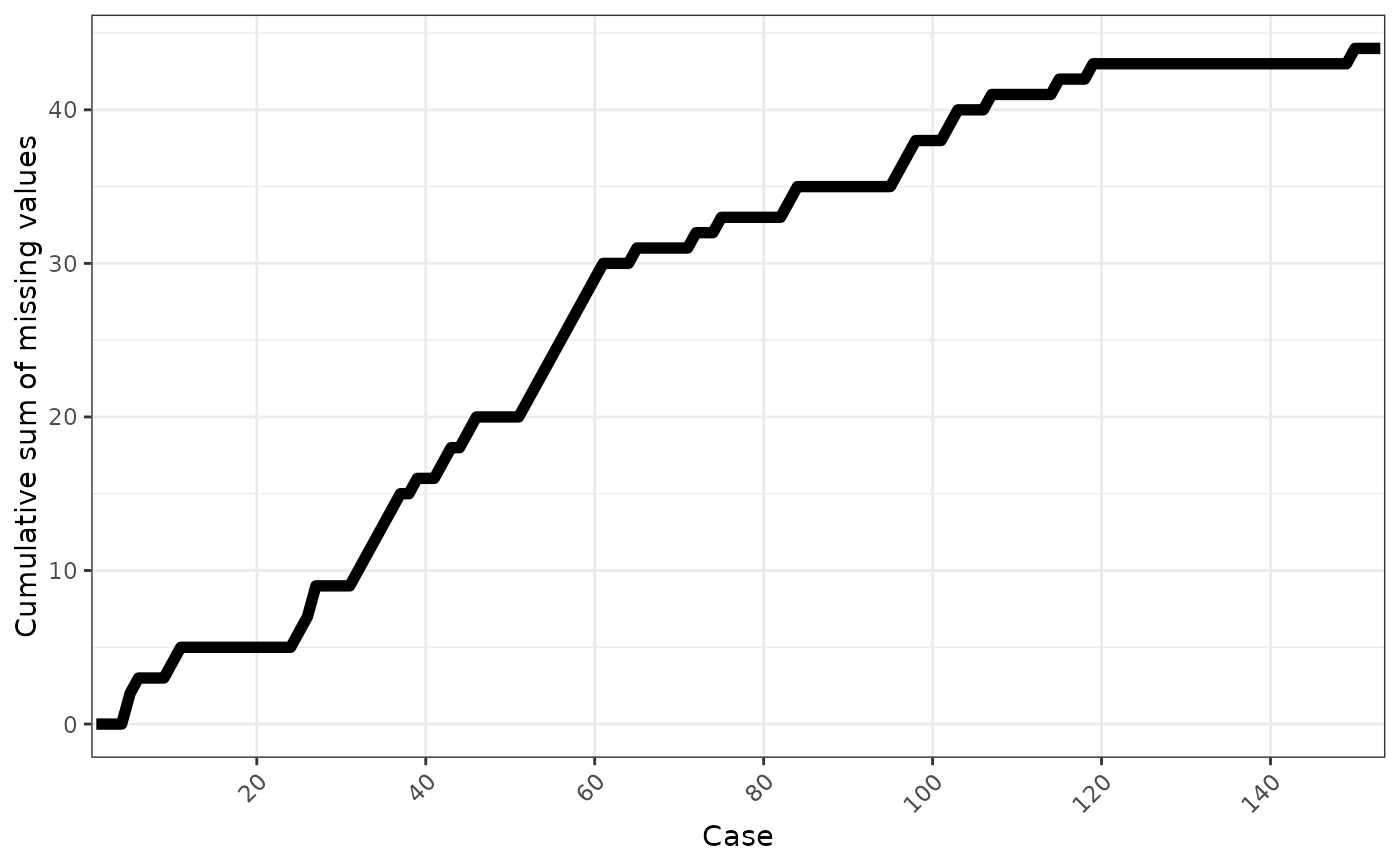
A plot showing the cumulative sum of missing values for cases, reading the
rows from the top to bottom. A default minimal theme is used, which can be
customised as normal for ggplot.
Usage
gg_miss_case_cumsum(x, breaks = 20)
Arguments
- x
a dataframe
- breaks
the breaks for the x axis default is 20
Value
a ggplot object depicting the number of missings
Examples
gg_miss_case_cumsum(airquality)