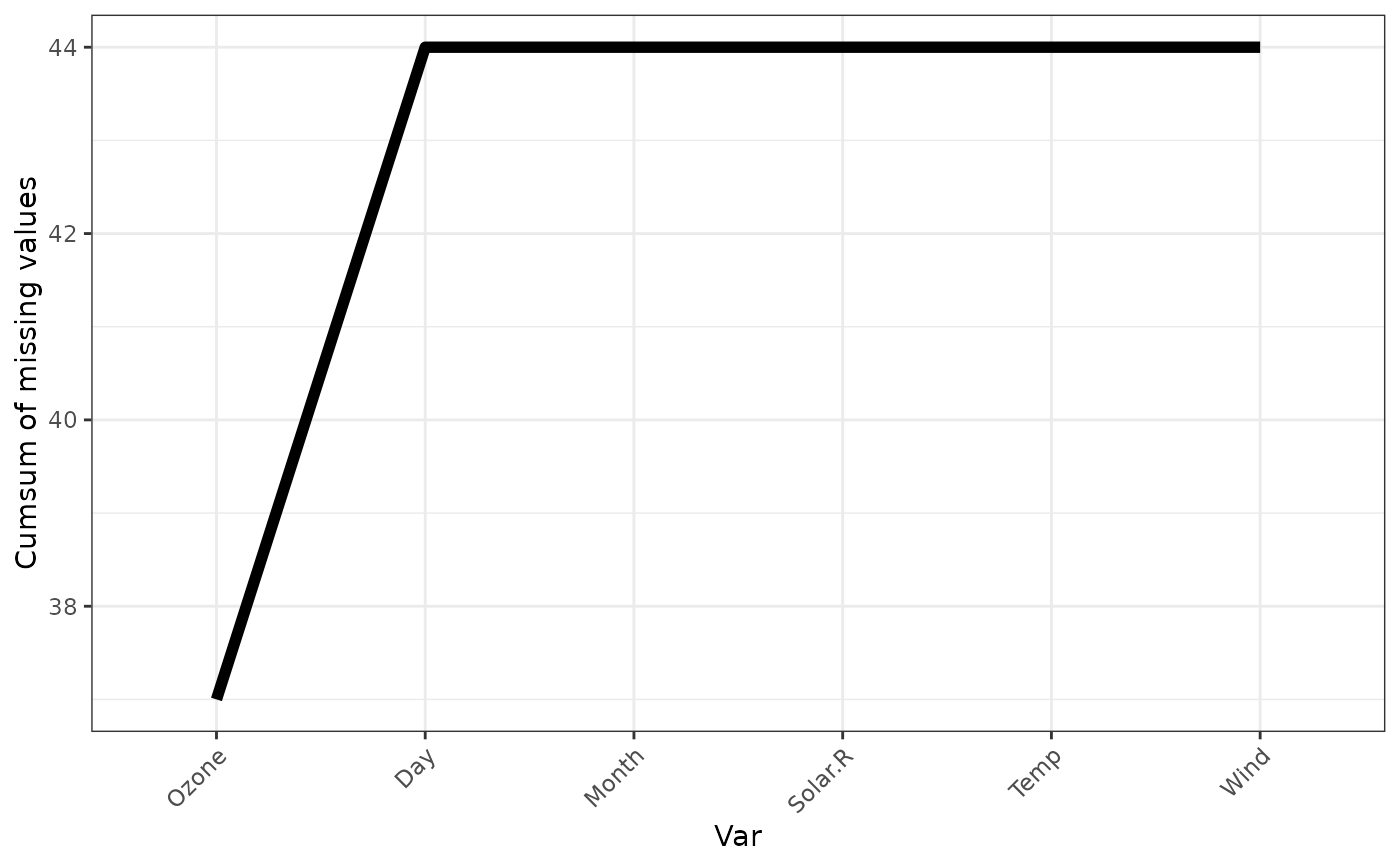
Plot of cumulative sum of missing value for each variable
Source:R/gg-miss-var-cumsum.R
gg_miss_var_cumsum.RdA plot showing the cumulative sum of missing values for each variable, reading columns from the left to the right of the initial dataframe. A default minimal theme is used, which can be customised as normal for ggplot.